Idle Reports

EROAD Idle Report reduces fuel and maintenance costs

EROAD Idle Report improves fuel economy and reduces engine wear and tear by displaying average and total idle time by vehicle.

2022_AUS_Idle_Report

Idling, as it turns out, is a leading factor in fuel waste. An EROAD study found that, on average, 7 percent of customers’ fuel consumption is burned in non-productive vehicle idling. (Productive idling such as that required to run compressors, cranes, and other auxiliary equipment is exempt from this figure.)

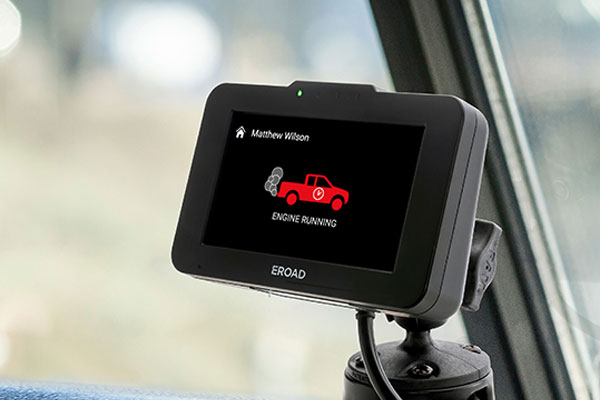
EROAD Idle Report improves fuel economy and reduces engine wear and tear by displaying average and total idle time by vehicle. The Ehubo2 alerts drivers in real-time to excess idling, giving the ability to self-monitor their idling behaviour. The costs saved by monitoring idle events and tracking behaviour over time will deliver significant improvements to your bottom line.

7-Ways_cut-fleet-cost
AU-MyEROAD_Activity-600x400-1

Switch off and save

You can achieve major cost savings from operating vehicles more efficiently by managing idle times. Lower idle times save fuel and money, and reduce emissions, engine wear and maintenance costs.

EROAD’s user-friendly tools and reports help you identify key trends, exceptions and unusual idle behaviour. With greater transparency and understanding, you can implement changes to drive better productivity across your fleet.

With EROAD Idle Reports, you can:

Reduce-fuel -and-maintenance-cost

Reduce fuel and maintenance costs

By minimising idling you can make significant savings on your fuel bill and the costs of engine wear and tear, to improve profitability
improve-driving

Improve driving

Identify vehicles and drivers with high rates of idling events for support with education programmes
Lower-emissions

Lower emissions

Minimise the environmental impact of damaging emissions, reduce noise and meet legal restrictions
Increase-productivity

Increase productivity

Drill down to understand specific idle events and identify the potential for interventions such as heaters, diesel-powered generators or accommodation policies to support drivers in safely reducing unproductive idling

Key features

The Ehubo2 alerts drivers in real-time to their idling behaviour
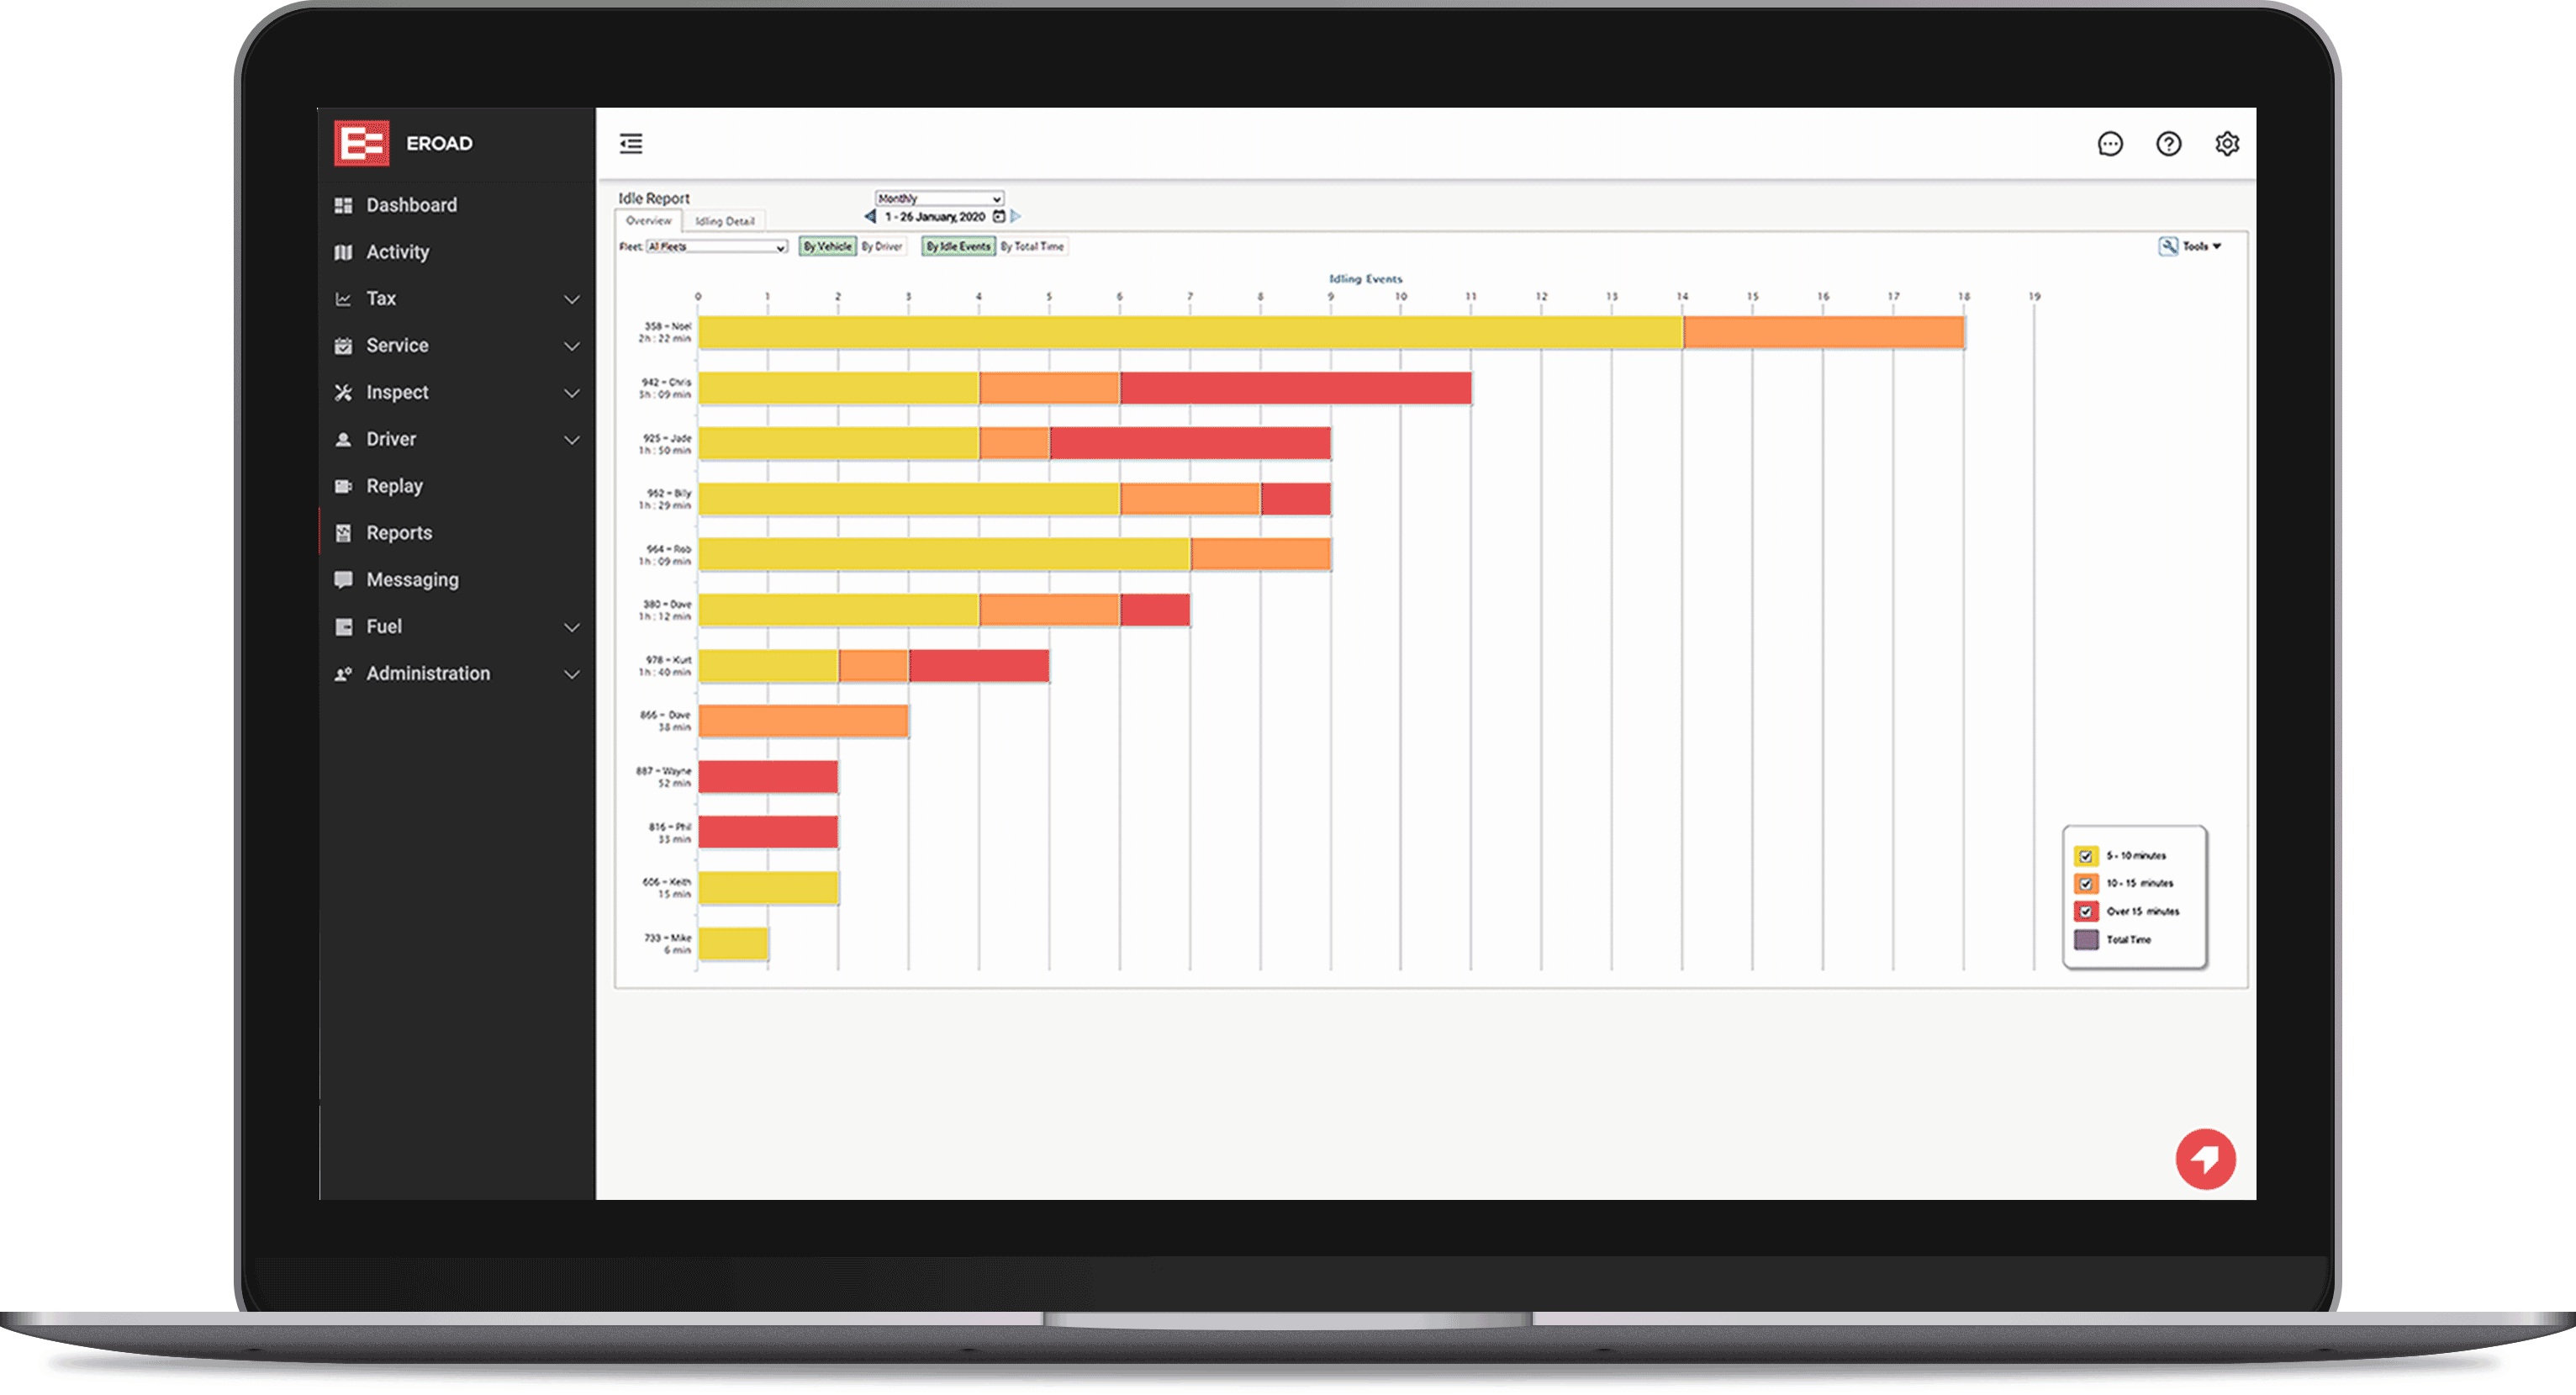
Average and total idle time by vehicle
Coloured bar chart that highlights frequency and idle duration by vehicle
Details of idle events including location, date, time and idle duration
Daily, monthly, quarterly and yearly reports for you to evaluate idle trends
Export your reports to PDF and CSV formats